Have you ever opened a giant spreadsheet or dataset and thought, “Where on earth do I begin?” You’re not alone. That’s exactly where Exploratory Data Analysis (EDA) comes in. Think of it as having a friendly first chat with your data—learning its habits, quirks, and hidden stories before diving deeper.
In the world of data science, EDA isn’t just useful—it’s essential. Before you jump into building complex models or making predictions, you need to truly understand your data. EDA helps you uncover patterns, trends, and anomalies that can make the difference between a good analysis and a great one.
Let’s walk through it step by step—no jargon overload, just a simple, beginner-friendly guide.
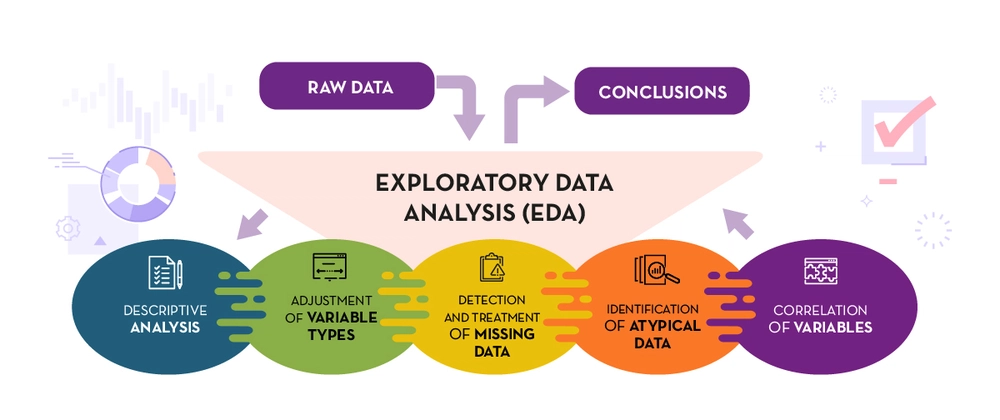
What Exactly is Exploratory Data Analysis (EDA)?
At its core, exploratory data analysis is all about exploring your dataset to summarize its key characteristics—often using visuals to make things clearer.
Imagine you’re a detective solving a case. EDA is the stage where you’re examining the clues, piecing together the picture, and figuring out what story the data is trying to tell.
Here’s what EDA helps you do:
- Understand your data: What’s inside it? What does it look like?
- Catch mistakes early: Missing values, typos, or unusual entries.
- Spot hidden connections: Relationships and patterns you wouldn’t notice just by glancing at rows and columns.
Whether you’re a student dipping your toes into data science or a professional tackling a new dataset, EDA is the foundation that sets you up for success.
Data Visualization Basics: Turning Numbers into Pictures
Let’s be honest, rows of numbers can feel overwhelming. But when you turn those numbers into visuals, suddenly the story becomes easier to follow. That’s the magic of data visualization in EDA.
Here are some beginner-friendly visualization tools you’ll often use:
- Histograms – Perfect for seeing how values are spread out (e.g., exam scores in a class).
- Scatter Plots – Show relationships between two variables (e.g., study time vs. grades).
- Box Plots – Great for spotting outliers and understanding ranges.
- Line Charts – Ideal for tracking changes and trends over time (e.g., monthly sales).
For instance, if you’re analyzing sales data, a simple line chart could instantly reveal whether sales are climbing, dropping, or bouncing around unpredictably.
Visualization isn’t just pretty graphs—it’s the bridge that helps you and others understand the data without getting lost in numbers.
Identifying Patterns and Trends
One of the most exciting parts of EDA is spotting patterns. These patterns often answer real-life questions like:
- Do students who study longer hours consistently score higher?
- Are weekends busier for online shopping than weekdays?
- Do sales spike right before holidays?
By identifying trends in data, businesses and researchers can make smarter, data-driven decisions. For example, if a company notices that demand always peaks in the summer, they can stock up in advance and launch seasonal promotions.
The truth is that raw data doesn’t always reveal these insights clearly. But with EDA, you connect the dots and bring those hidden patterns into focus.
Anomaly Detection: Spotting the Odd Ones Out
Data doesn’t always behave. Sometimes, you’ll find unusual values that don’t fit the norm—these are called anomalies or outliers. Detecting them is a key part of exploratory data analysis.
Why should you care about anomalies?
- They could mean errors (like a typo in data entry).
- They might expose fraudulent activity (think of a sudden strange bank transaction).
- Or they could highlight rare opportunities (such as an unexpected spike in website traffic).
For example, if a student usually scores between 70–80 but suddenly scores 100, that’s an anomaly worth digging into. Similarly, if sales suddenly plummet one month, it could point to supply chain issues—or even market changes.
EDA shines here because it helps you catch anomalies early, so your decisions and models are based on accurate information.
Wrapping It Up: Let Your Data Talk
At the end of the day, Exploratory Data Analysis (EDA) is about much more than crunching numbers—it’s about listening to the story your data is trying to tell. With the help of data visualization, the ability to uncover patterns and trends, and tools to detect anomalies, EDA gives you a deeper, more reliable understanding of your dataset.
So, the next time you face a new dataset, resist the urge to rush into building models. Take a moment, explore the data, and let it speak first—you’ll be surprised at what it reveals.
Ready to get started? Begin small. Pick a dataset, create a few charts, and practice spotting patterns. With every step, you’ll not just learn data science—you’ll learn to think like a data detective.
just learn data science—you’ll learn to think like a data detective.


 in Data Science? A Beginner-Friendly Guide with Examples)
 in Data Science? A Beginner-Friendly Guide with Examples&description=&image=https://blog.praxiaskill.com/wp-content/uploads/2025/08/Exploratory-Data-Analysis-EDA-in-Data-Science.webp)