In today’s digital world, data is everywhere. Every click on a website, every product purchased online, every review written, and even every step tracked on your smartwatch creates data. Businesses, apps, and organizations collect this information because it holds valuable clues about people’s behaviour.
But here’s the catch: raw data by itself isn’t very useful. To turn it into something meaningful—like understanding customer needs, spotting trends, or improving services—we need to process it. This journey, known as the data analytics process, takes data from its raw form and transforms it into insights that can guide better decisions.
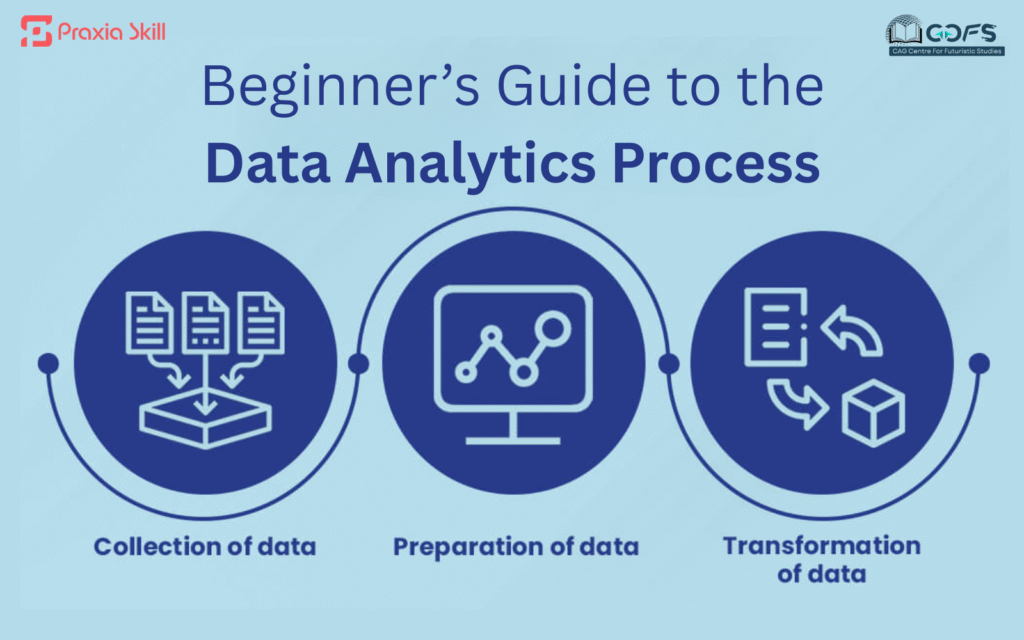
Let’s walk through the three main steps of this process: data collection, cleaning and preprocessing, and analysis with visualization.
Step 1: Data Collection – Gathering Information
The first stage is collecting data. Without data, there’s nothing to analyze. Organizations gather it from different sources depending on their goals:
- Websites and apps: Tracking how many people visit a site, what they click on, and how long they stay.
- Surveys and forms: Collecting direct feedback from customers or employees.
- Devices and sensors: For example, fitness trackers measuring steps or factories monitoring machine performance.
- Business systems: Sales reports, customer records, or marketing campaign data.
Think about an online store: it might collect data on what items people view, which products are added to the cart, and how many visitors make a purchase. That information helps the business understand its customers better.
At this stage, the goal is simple—gather as much relevant information as possible.
Step 2: Cleaning and Preprocessing – Making the Data Usable
Raw data is rarely neat. It usually contains mistakes, missing information, or inconsistencies. For example:
- Duplicate entries (the same person recorded twice).
- Errors (like spelling mistakes or incorrect numbers).
- Missing values (someone skipped a survey question).
- Inconsistent formats (dates written as “01/02/25” in one place and “Feb 1, 2025” in another).
If left unaddressed, these issues can lead to misleading results. Imagine deciding based on inaccurate data—it could cost time, money, and effort.
That’s why the cleaning and preprocessing stage is so important. It involves:
- Removing duplicates.
- Correcting errors.
- Filling in missing information where possible.
- Standardizing formats so everything looks the same.
Once data is cleaned, it becomes reliable and ready for meaningful analysis. In short, this step ensures that the foundation of your insights is solid.
Step 3: Analysis and Visualization – Finding the Story in the Data
Now comes the exciting part—turning clean data into insights. Analysis helps you answer questions, find patterns, and identify trends that weren’t obvious before.
Some examples include:
- A café discovers that sales of iced drinks peak in summer afternoons.
- An e-commerce website learning that customers who buy shoes are also likely to buy socks.
- A marketing team is figuring out which ad campaign brought the most conversions.
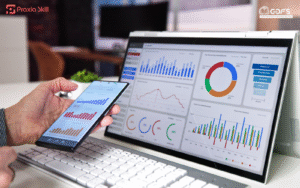
But raw numbers can be difficult to understand. This is where visualization plays a huge role. By presenting data as charts, graphs, or dashboards, patterns become clear briefly.
- Bar charts show which products are most popular.
- Line graphs reveal how sales change over time.
- Heat maps highlight which areas of a webpage get the most clicks.
Visualization not only simplifies complex information but also makes it easier for decision-makers to act quickly.
Why It Matters
The data analytics process is about more than just numbers. It’s about making smarter, fact-based decisions. Instead of relying on guesswork or intuition, businesses can use analytics to truly understand their customers and improve their services.
Here are some real-world ways analytics makes a difference:
- Businesses can predict trends and create better products.
- Healthcare providers can track patient progress and improve treatment.
- Governments can plan safer cities with traffic and population data.
- Individuals can use data to track spending, health, or productivity.
Analytics bridges the gap between information and action.
Final Thoughts
The journey from raw data to actionable insights involves three clear steps:
- Collecting data from the right sources.
- Cleaning and preparing it so it’s accurate.
- Analyzing and visualizing it to uncover the story within.
When done right, this process helps businesses and individuals make decisions that are smarter, faster, and more effective.
In the end, data is only valuable if it’s understood. And with analytics, anyone—from a business owner to a beginner—can turn numbers into insights that drive real impact.
Takeaway: Data isn’t just information—it’s a powerful tool. When analyzed properly, it becomes the key to smarter choices in business, marketing, healthcare, and everyday life.
