
When you run a website or post on social media, it’s natural to wonder—Are people noticing this? That’s where analytics comes in. Think of analytics as a friendly guide that shows you what’s working, what isn’t, and where you can do better. Instead of guessing, you get real answers backed by numbers.
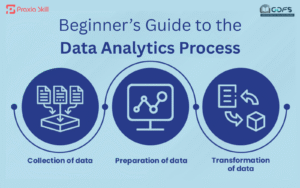
Let’s break it down step by step.
Introduction to Google Analytics & Meta Insights
Two of the most common tools beginners hear about are Google Analytics and Meta Insights (for Facebook and Instagram).
- Google Analytics is like CCTV for your website. It tells you how many people visit, where they come from, how long they stay, and what they do.
- Meta Insights is like a performance tracker for your social media. It shows who engages with your posts, how far your content reaches, and which posts get the most love.
In short:
- Google Analytics = Website health check
- Meta Insights = Social media report card
The magic, however, isn’t just in the numbers—it’s in learning what those numbers mean for your next move.
Tracking Website Visitors & Conversions
Imagine you own an online clothing store. Analytics lets you peek into your digital shop and answer questions like:
- How many people walk in (visit your site) every day?
- Which aisles they check out (dresses vs. shoes)?
- How many buy something (conversions)?
Visitors are like people browsing in your shop. Conversions are when they finally head to the billing counter.
Analytics also helps you spot patterns. For example:
- Do free shipping offers make people buy more?
- Which ads are bringing in the most traffic?
- Is your mobile site working as smoothly as the desktop version?
With this info, you stop guessing and start making smart, data-driven decisions.
Understanding Bounce Rate, CTR, and Engagement
Some terms may sound complicated, but let’s make them super simple.
-
Bounce Rate
Think of it as customers who step into your shop, glance around, and walk out without exploring.
- A high bounce rate means people are leaving quickly.
- Reasons could be slow page speed, boring content, or not finding what they expected.
-
CTR (Click-Through Rate)
CTR shows how many people click on something you show them—an ad, a link, or a button.
- Example: 100 people see your ad, 5 click it → CTR = 5%.
- A higher CTR means your content grabs attention.
-
Engagement
Engagement tells you how much people interact with your content.
- On social media → likes, shares, comments.
- On websites → time spent on pages, clicking multiple links.
In short:
- Bounce Rate = People leaving too soon
- CTR = People clicking through
- Engagement = People interacting
How Analytics Helps You Improve Step by Step
This is where analytics gets exciting—it’s like feedback from your customers, even if they don’t say a word.
- Example 1: Website
If your homepage has a high bounce rate, it’s a red flag. Maybe the design is messy, or the message isn’t clear. Fixing it could instantly keep people around longer. - Example 2: Ads
Low CTR? Try a new headline, better image, or clearer call-to-action. Analytics lets you A/B test and compare which version works best. - Example 3: Social media
If Meta Insights shows your videos get more engagement than images, you know what to post more of.
Analytics is less about numbers and more about direction. It tells you where to adjust your efforts for better results.
Why Analytics Matters for Beginners
When you’re new to digital marketing, analytics can feel like learning a new language. But here’s the trick—you don’t need to know everything at once. Start small.
Focus on just three things:
- How many visitors you’re getting
- What content works best
- Where people drop off
Over time, you’ll notice patterns, gain confidence, and start making smarter decisions without second-guessing yourself.
Think of analytics as a compass. It won’t walk the journey for you, but it will always point you in the right direction.
Final Thoughts
Every click, view, or share tells a story. Analytics helps you listen to that story.
- Google Analytics shows what’s happening on your website.
- Meta Insights reveals how people respond to your social media.
Together, they give you a complete picture of how your audience interacts with your business online.
By tracking visitors, conversions, bounce rate, CTR, and engagement, you move from guesswork to smart work.
So, if you’ve been running a website or posting online without checking analytics, now’s the time to start. Think of it as your digital report card—it may surprise you, guide you, and even inspire your next big win.

